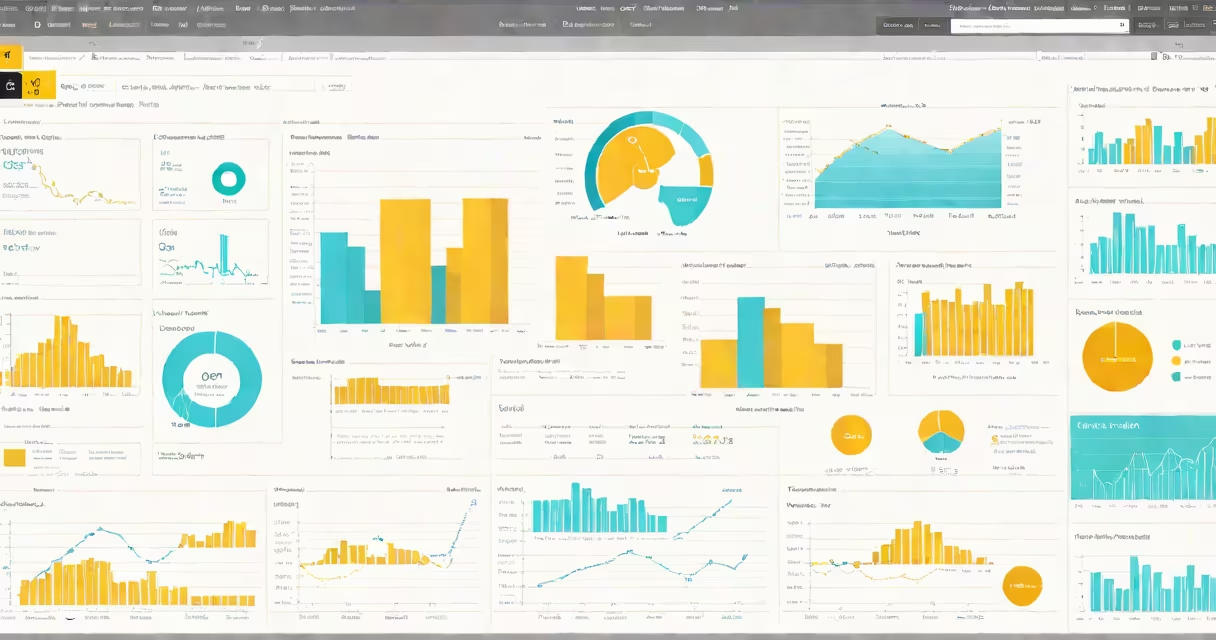
Power BI is a Microsoft business analytics platform that connects to data sources, transforms raw data into interactive visual dashboards, and enables users to explore insights through customizable reports. It runs on Windows, web browsers, and mobile apps, and integrates with Excel, Azure, and SQL Server.
At its core, Power BI processes data from spreadsheets, databases, cloud services, and APIs. It cleans, models, and organizes the data using DAX (Data Analysis Expressions), then renders it as visuals-charts, maps, tables, and KPIs-on dashboards. Users can filter, drill down, and share these views in real time.
For example, a retail manager imports monthly sales data from a SQL database. Power BI combines that with inventory levels and regional demographics. The result is a live dashboard showing which stores are underperforming, which products are driving revenue, and how promotions affect foot traffic-all updated automatically.
Power BI operates in three stages: data ingestion, transformation, and visualization. First, it pulls data from sources like Excel files, Salesforce, Google Analytics, or PostgreSQL. The data is loaded into the Power Query Editor, where users can clean duplicates, fix formatting, and merge tables.
Next, the model layer defines relationships between tables using DAX. This allows calculations such as year-over-year growth, market share, or forecasted demand. For instance, a marketing team might calculate customer acquisition cost by dividing campaign spend by new sign-ups.
Finally, the report canvas displays visuals. Users drag fields onto axes, choose chart types, and apply conditional formatting. Filters appear as slicers, enabling users to isolate data by region, date, or product category. Reports can be published to the Power BI service for sharing across teams.
Power BI consists of several components, each serving a distinct role in the workflow:
| Tool | Function | Use Case Example |
|---|---|---|
| Power BI Desktop | Free desktop app for building reports and dashboards | Creating a sales performance dashboard using Excel and SQL data |
| Power BI Service | Cloud-based platform for publishing, sharing, and collaborating on reports | Sharing a live operations dashboard with executives across departments |
| Power BI Mobile | Apps for iOS and Android to view reports on smartphones and tablets | Field managers checking daily site metrics during site visits |
| Power BI Embedded | API for developers to embed Power BI reports into custom applications | Integrating financial forecasts into a client-facing SaaS portal |
Each component uses the same underlying engine. Data modeled in Power BI Desktop appears identically in the cloud service and mobile apps. This consistency helps insights remain accurate across devices and access levels.
Businesses use Power BI to turn data into decisions. A manufacturing company might track machine uptime, defect rates, and supply chain delays in a single dashboard. When downtime spikes, the system flags the issue, allowing maintenance teams to act before production halts.
According to Gartner, organizations using self-service BI tools like Power BI see a 30% improvement in decision-making speed compared to those relying solely on IT-generated reports. The tool reduces dependency on data analysts for basic queries, empowering finance, HR, and operations staff to explore data independently.
A common misconception is that Power BI requires coding. While DAX and M language (used in Power Query) offer advanced control, most users build effective reports using drag-and-drop interfaces. A marketing analyst with no programming background created a campaign ROI tracker using only buttons and dropdowns.
Power BI is not a database. It doesn't store large volumes of transactional data. Instead, it accesses data from existing systems-such as ERP or CRM platforms-and creates analytical views. Storing raw data in Power BI can lead to slow performance and high licensing costs.
Another confusion is equating Power BI with Excel. While both handle spreadsheets, Power BI offers far greater scalability. A spreadsheet with 1 million rows may freeze in Excel. Power BI processes the same dataset efficiently using columnar storage and in-memory processing.
Power BI does not replace data warehousing. It complements it. A well-designed data warehouse provides structured, validated data. Power BI consumes that data to generate insight. Without clean input, even the best Power BI report shows misleading patterns.
In 2022, a regional hospital network used Power BI to monitor patient wait times across 12 clinics. They connected to electronic health records (EHR), appointment scheduling systems, and staffing logs. The dashboard displayed average wait times by location, hour of day, and provider.
When data showed a 45-minute average wait at Clinic B on Mondays, administrators investigated. They discovered that two nurses were scheduled for training during peak hours. Adjusting shifts reduced wait times by 38% within two weeks. The hospital later expanded the dashboard to track readmission rates and medication adherence.
This outcome was possible because Power BI enabled rapid analysis without waiting for IT reports. Staff accessed the dashboard on tablets in clinic lobbies, identifying bottlenecks in real time.
Power BI supports strategic planning, operational monitoring, and performance tracking. It's used to measure KPIs, compare actual results against targets, and simulate scenarios. For example, a logistics firm models fuel cost changes based on route adjustments and fuel prices.
Understanding what about Power BI begins with recognizing it as a bridge between data and action. It doesn't solve problems-it reveals them. The value lies in how quickly users can spot trends, test assumptions, and adjust strategies based on evidence.
Power BI is not a replacement for judgment. It's a tool for sharpening it. When used correctly, it turns scattered numbers into clear direction.