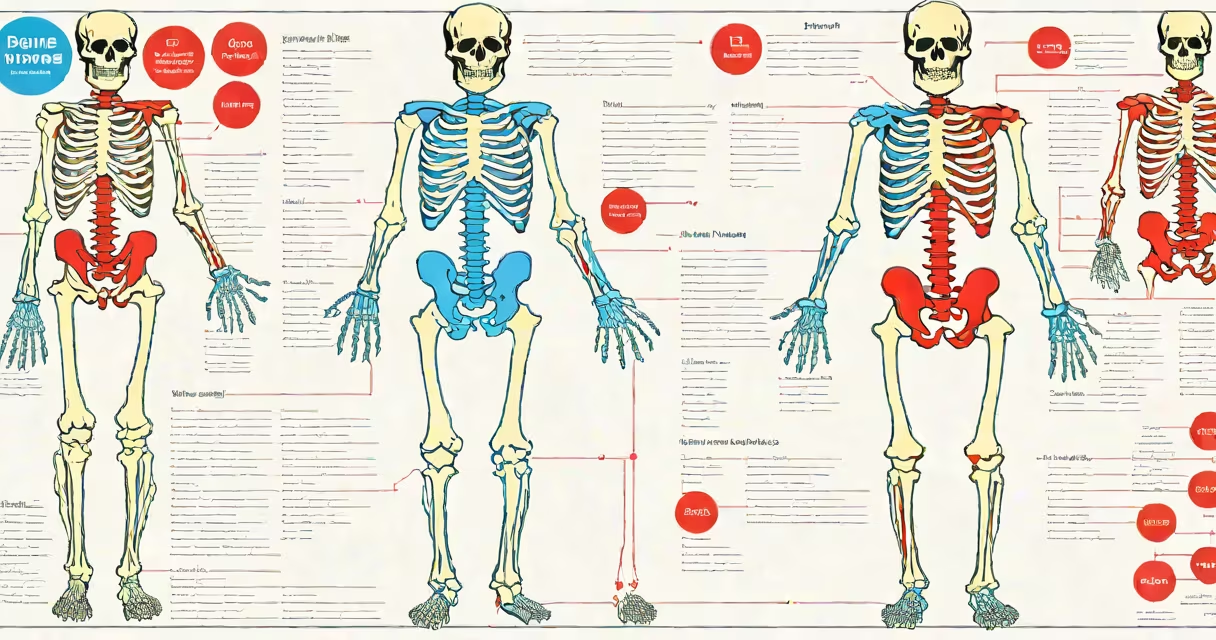
A bone chart of the human body is a visual reference showing the location, name, and classification of all 206 bones in the adult human skeleton. It serves as a standardized tool for medical professionals, students, and educators to identify and understand skeletal anatomy.
These charts display bones in anatomical position-standing upright, palms forward-and use consistent naming conventions. They often distinguish between axial (skull, vertebral column, rib cage) and appendicular (limbs, shoulder girdle, pelvic girdle) bones. Charts may show single bones in isolation or the entire skeleton in full view.
Most bone charts include both anterior (front) and posterior (back) views. Some include cross-sections or labeled joints. The most accurate versions align with the Terminologia Anatomica (TA), the international standard for anatomical terminology established by the Federative International Programme on Anatomical Terminologies (FIPAT).
Bone charts function as spatial maps of the human skeleton. Each bone is assigned a unique Latin name based on its shape, location, or function. For example, "femur" comes from the Latin word for thigh, while "tibia" refers to the shin bone.
Charts use color coding, numbering, or lettering to link visuals to textual labels. A typical chart includes a legend explaining symbols. Some charts integrate clinical notes-such as fracture sites or common congenital anomalies-to aid diagnosis and education.
Medical schools and anatomy labs rely on bone charts during dissection sessions. Students compare live cadaver specimens against printed or digital charts to verify bone identification. Digital versions allow zooming, rotating, and layering-features absent in static paper charts.
Bone charts vary by purpose and audience. Here's a breakdown of common formats:
| Type | Use Case | Detail Level | Example |
|---|---|---|---|
| Full-body schematic | Classroom instruction, exam prep | High | Standard 2D illustration with all 206 bones labeled |
| Regional focus | Orthopedic training, surgery planning | Very high | Isolated hand or foot with all 27 bones shown |
| Interactive 3D model | Virtual anatomy labs, AR/VR training | Extreme | Web-based viewer allowing rotation and layer removal |
| Minimalist diagram | Quick reference, flashcards | Low | Outline with only major bones marked |
Each type targets different learning goals. Full-body charts provide context. Regional charts offer precision. Interactive models support changing understanding. Minimalist diagrams serve memory recall.
Some charts emphasize developmental changes. Children have more bones than adults-around 270 at birth-due to unfused epiphyses. As growth plates close, bones fuse. A bone chart for adolescents may show fused versus unfused regions.
People often assume all bones are visible or palpable. This is false. The ethmoid bone, located in the skull base, is hidden behind the nasal cavity and cannot be felt externally. Similarly, the sesamoid bones in the hands and feet are tiny and embedded in tendons-most are invisible without imaging.
Another error is confusing bone names across species. The "humerus" is the upper arm bone in humans-but in birds, it's part of the wing structure adapted for flight. A bone chart must reflect human-specific anatomy, not comparative zoology.
Some online resources label the "collarbone" as "clavicle" but omit that "clavicle" is the formal anatomical term. Using colloquial names like "knee cap" instead of "patella" leads to confusion in clinical settings. Always use TA-approved nomenclature.
In a 2021 study published in Anatomical Sciences Education, researchers found that medical students using interactive bone charts scored 23% higher on bone identification tests than those using static images. The study involved 147 first-year students across six universities.
Consider a student identifying the sphenoid bone-a complex, butterfly-shaped bone at the base of the skull. A static chart shows it near the sella turcica, but doesn't reveal its relationship to the optic canal or foramen ovale. An interactive chart allows the student to rotate the view, isolate the sphenoid, and see how it connects to the temporal and frontal bones.
This level of detail matters in diagnosing conditions like pituitary tumors, which compress the optic chiasm through the sella. Knowing the sphenoid's role in housing cranial nerves is essential for surgical planning.
I once used a 3D bone chart during a cadaver lab at Johns Hopkins University. When we reached the pelvis, a peer struggled to locate the ischium. The instructor pulled up a digital chart on a tablet, rotated the model, and highlighted the bone's position relative to the pubis and ilium. Within seconds, the correct structure became obvious. That moment confirmed how important accurate visualization tools are-even for experienced learners.
Understanding the skull of the human body is foundational. The skull contains 22 bones (8 cranial, 14 facial) and forms the protective cranium. Its complexity makes it a frequent focus in bone charts, especially for neurology and trauma medicine.
Bone charts are not just educational-they're diagnostic tools. Radiologists use them to interpret X-rays, CT scans, and MRIs. A misplaced label or missing bone can lead to misdiagnosis. Accuracy is non-negotiable.
Always consult peer-reviewed sources when using bone charts. The National Library of Medicine's Visible Human Project and the University of Michigan's Body Parts database offer vetted, high-resolution models aligned with TA standards.
A bone chart of the human body is not a decorative image-it's a functional map of the body's structural structure. Whether for study, practice, or patient care, it remains central to human anatomy.