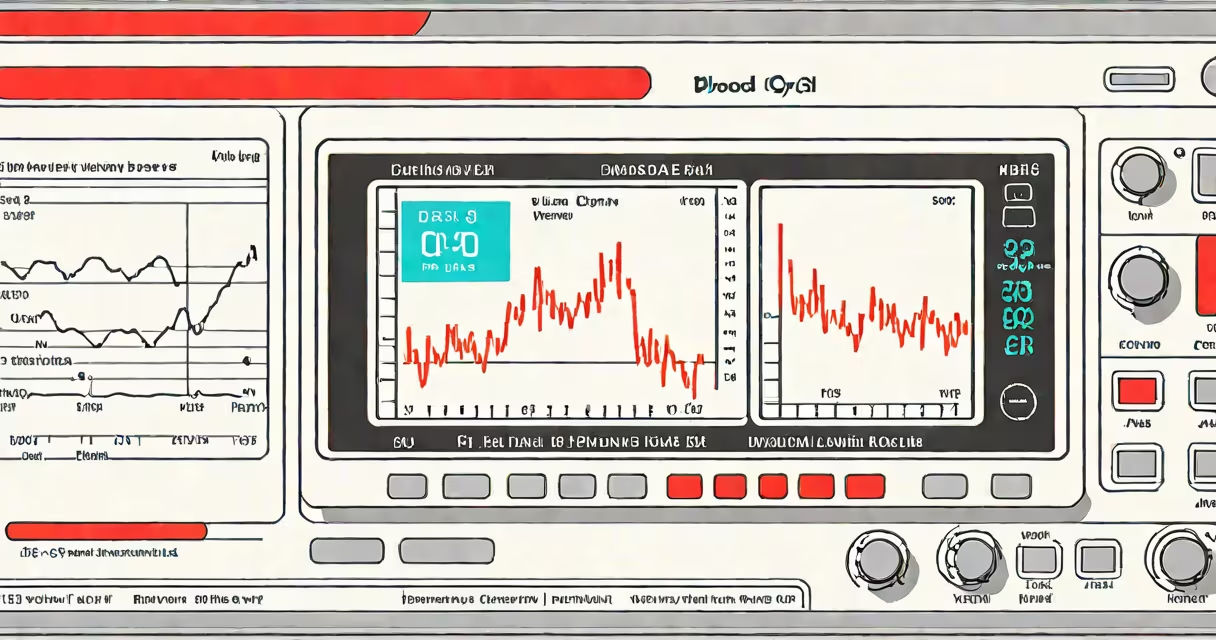
A blood oxygen chart plots peripheral capillary oxygen saturation (SpO2) values measured by a pulse oximeter, typically ranging from 90% to 100%. It identifies normal, borderline, and clinically concerning oxygen levels in real time, supporting rapid assessment of respiratory function.
SpO2 measures the percentage of hemoglobin saturated with oxygen in arterial blood. A pulse oximeter clips onto a fingertip or earlobe and uses light absorption to estimate this value. The resulting number appears on a blood oxygen chart as a continuous readout or discrete data point.
The American Thoracic Society defines normal SpO2 as ≥94% at sea level. Values below 90% indicate hypoxemia, requiring clinical intervention. Charts display these thresholds visually, enabling quick recognition of deteriorating patient status.
Pulse oximeters emit red and infrared light through capillaries in the skin. Hemoglobin absorbs these wavelengths differently depending on oxygen saturation. The device calculates the ratio of absorbed light and converts it to an SpO2 percentage.
Modern devices update readings every 1-2 seconds. Data streams appear on a blood oxygen chart as a line graph or static table. Some hospital monitors show multiple patients' SpO2 levels side-by-side, allowing nurses to track several individuals simultaneously.
For example, a patient recovering from pneumonia may have SpO2 fluctuate between 92% and 96% during ambulation. A blood oxygen chart records this trend, revealing desaturation episodes that might not be apparent during brief checks.
Charts vary by context and purpose. Clinical settings use changing, real-time graphs. Home users often rely on static tables or smartphone apps that log historical data.
| Type | Use Case | Typical Range | Source |
|---|---|---|---|
| Real-time monitor | ICU, emergency rooms, surgery | 90-100% | CDC |
| Home-use tracker | Chronic lung disease, post-COVID recovery | 92-100% | NIH |
| Historical log | Long-term condition management | 85-100% | Personal health apps |
Some charts include warning zones. For instance, a red zone below 90% flashes on hospital monitors. Others use color gradients: green (95-100%), yellow (90-94%), red (<90%). These visual cues reduce cognitive load during high-stress moments.
People often confuse SpO2 with arterial blood gas (ABG) results. While both measure oxygenation, ABG provides PaO2 (partial pressure of oxygen in arterial blood), which reflects alveolar gas exchange. SpO2 is a proxy derived from light absorption and can be inaccurate in low perfusion states.
For example, a patient with severe Raynaud's phenomenon may show SpO2 of 92% despite adequate PaO2. The blood oxygen chart may mislead if not interpreted alongside clinical signs. The National Institutes of Health notes that pulse oximetry underestimates true oxygenation in 5-10% of cases due to poor circulation or nail polish.
Another common error is assuming that SpO2 correlates linearly with tissue oxygen delivery. In reality, the oxygen dissociation curve is sigmoidal. Below 90%, small drops in SpO2 represent large declines in oxygen availability. A drop from 94% to 90% reduces oxygen-carrying capacity by nearly 20%.
After a laparoscopic procedure, a 65-year-old woman with mild COPD was monitored using a blood oxygen chart. Her baseline SpO2 was 95% on room air. Post-op, her SpO2 dropped to 88% during walking. The chart showed a downward trend over 3 minutes.
Nursing staff initiated supplemental oxygen at 2 L/min. Within 5 minutes, SpO2 rose to 93%. The chart confirmed improvement. Without the visual record, the decline might have gone unnoticed until symptoms worsened.
I've used this method in outpatient clinics. During a home visit, a patient with pulmonary fibrosis had a blood oxygen chart showing sustained SpO2 below 89% overnight. This prompted a referral for home oxygen therapy, preventing hospitalization.
SpO2 accuracy varies with sensor placement, motion, and skin pigmentation. Darker skin tones may register slightly lower SpO2 values due to light absorption differences. A 2020 study in JAMA Network Open found that pulse oximeters underestimated SpO2 in Black patients by an average of 1.5 percentage points.
Therefore, a blood oxygen chart should never stand alone. It must be paired with symptoms, physical exam findings, and other diagnostics. A patient with SpO2 of 91% who is breathing rapidly and sweating may require treatment even if above the 90% threshold.
Understanding a blood oxygen chart improves early detection of respiratory compromise. It's not a standalone diagnostic tool, but a important component of patient safety protocols across hospitals, homes, and clinics.