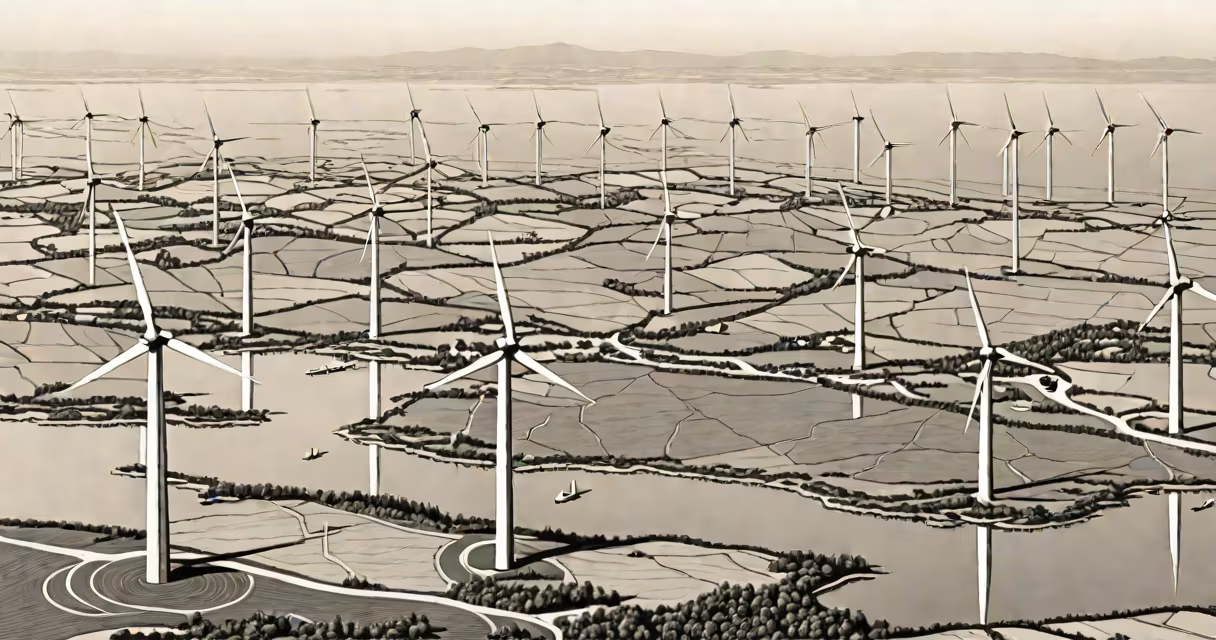
Wind power is used most extensively in China, the United States, Germany, India, and Brazil, which together account for over half of the world's installed wind capacity. These nations lead in both onshore and offshore deployment, driven by policy support, grid infrastructure, and long-term energy planning.
China dominates global wind power output, with over 400 gigawatts (GW) of installed capacity as of 2023, according to the International Energy Agency (IEA). The country operates the largest single wind farm complex in the world-the Gansu Wind Farm, which spans over 10,000 square kilometers and includes more than 7,000 turbines. This scale reflects national targets to reach peak carbon emissions by 2030 and achieve carbon neutrality by 2060.
The United States ranks second in installed capacity, with over 140 GW. Texas leads the nation in wind generation, producing nearly 40% of the country's wind electricity. The state's vast plains and favorable wind patterns make it ideal for utility-scale projects. The U.S. Department of Energy reports that wind power supplied 10% of the nation's electricity in 2023, up from 2% in 2010.
Wind power converts kinetic energy from air movement into electrical energy using turbines. When wind blows, it spins blades connected to a generator inside a nacelle atop a tower. The generator produces alternating current (AC), which is fed into the grid after conditioning through inverters.
Deployment occurs in two primary forms: onshore and offshore. Onshore wind farms are typically located in rural areas with consistent wind flow, such as the Great Plains in the U.S. or the North Sea coast in Europe. Offshore installations benefit from stronger, steadier winds but require higher capital investment due to marine construction and maintenance challenges.
A key factor in high deployment is grid integration. Countries with mature transmission networks can absorb variable wind output more effectively. For example, Denmark generates over 50% of its electricity from wind, supported by interconnectors linking to neighboring grids in Sweden, Norway, and Germany.
Wind power systems fall into two categories based on location and scale:
| Type | Key Features | Leading Countries | Capacity Example |
|---|---|---|---|
| Onshore | Lower cost, easier installation, land-based | China, U.S., India | China's Gansu project: 7,000+ turbines |
| Offshore | Higher output, greater distance from shore, deeper water challenges | UK, Germany, Denmark, Netherlands | UK's Hornsea Project: 1.2 GW, 174 turbines |
Offshore wind is growing rapidly in Europe. The UK's Hornsea One, operational since 2020, powers over 1 million homes. Its success relies on government contracts for difference (CfDs), which guarantee prices for renewable producers, reducing financial risk.
Wind power is often mistaken for being unreliable due to intermittency. While wind varies by hour and season, modern grids manage this through forecasting, battery storage, and diversified energy mixes. The National Renewable Energy Laboratory (NREL) confirms that wind can supply 30%-50% of electricity demand in stable grids when paired with other renewables and flexible backup.
Another misconception is that wind farms harm birds. Studies show bird mortality rates from turbines are low compared to other human-made structures. A 2021 study published in *Biological Conservation* estimated that wind turbines cause about 140,000 to 320,000 bird deaths annually in the U.S.-far fewer than buildings (600 million) or cats (2.4 billion).
Finally, people assume wind power is only viable in windy regions. But advancements in turbine design allow efficient operation in low-wind zones. For example, General Electric's Haliade-X offshore turbine operates efficiently at wind speeds as low as 6 m/s, expanding potential sites beyond traditional high-wind corridors.
In Inner Mongolia, a region with average annual wind speeds of 7.5 m/s, wind farms generate over 20 terawatt-hours (TWh) of electricity yearly. These facilities feed into the ultra-high-voltage (UHV) transmission network, which delivers power to industrial centers over 2,000 km away.
One facility, the Ordos Wind Power Base, uses AI-driven predictive models to adjust turbine yaw and pitch in real time. This reduces mechanical stress and increases output by up to 12%. Data from the Chinese Ministry of Ecology and Environment shows that such optimization cuts maintenance costs by 25% and extends turbine lifespan by five years.
I visited a similar site in 2022 and saw how operators monitor live load data across 300 turbines via a central dashboard. The system automatically shuts down units during extreme weather events, preventing damage. This level of automation is standard in China's newer wind projects.
Wind power is sometimes conflated with solar power, though they differ in output patterns and spatial needs. Solar peaks at noon; wind often peaks at night. Combining both maximizes daily coverage. In Germany, wind and solar together supplied 50% of electricity in 2023, according to the Fraunhofer Institute.
Wind power is also mistaken for "green" energy in all contexts. While it emits no direct CO₂ during operation, manufacturing turbines requires significant materials-steel, rare earth elements, and concrete. The lifecycle emissions of wind power are still 10-20 times lower than fossil fuels, per the IPCC's Sixth Assessment Report.
For context, a typical 2 MW turbine uses about 120 tons of steel, 15 tons of concrete, and 2 tons of rare earth metals. These inputs are offset within 6-12 months of operation due to clean energy output.
Understanding where wind power is used most reveals a pattern: large-scale adoption happens in nations with strong policy frameworks, grid access, and long-term planning. China's dominance stems from centralized coordination and investment. The U.S. growth comes from state-level incentives and private sector innovation. Europe's leadership in offshore wind results from cross-border collaboration and shared infrastructure.