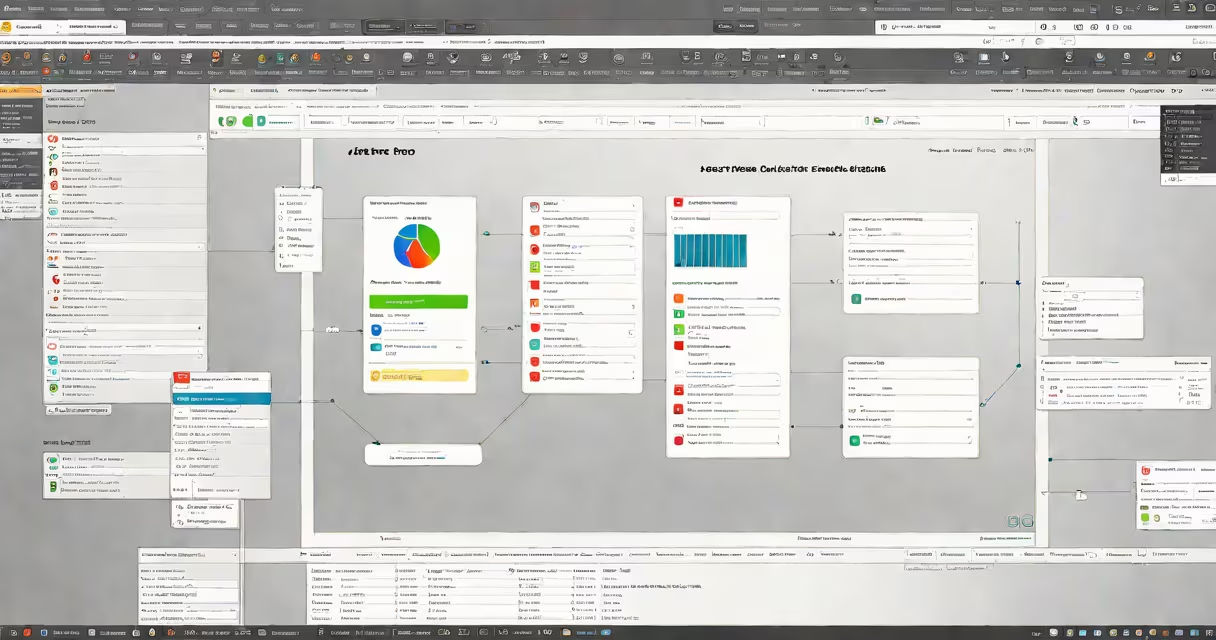
Apache JMeter is an open-source desktop application designed to test the performance and load-handling capacity of web applications, APIs, and servers. It simulates hundreds or thousands of concurrent users to measure response times, throughput, error rates, and system stability under stress.
JMeter was originally developed for testing web applications but now supports many protocols including HTTP, HTTPS, FTP, JDBC, SOAP, REST, and WebSocket. It runs on Java and is available for Windows, macOS, and Linux.
Developed and maintained by the Apache Software Foundation, JMeter is widely adopted in software development and QA environments for identifying bottlenecks before production deployment. It's used by engineering teams at companies like Netflix, Spotify, and Amazon to validate system behavior under high traffic.
JMeter operates by creating a test plan-a structured set of instructions that define how tests run. The test plan includes virtual users (threads), test logic (requests), and performance metrics collection.
Each test begins with a Thread Group, which defines the number of simulated users and how long they run. For example, a Thread Group can simulate 1,000 users sending HTTP requests to a login endpoint over 10 minutes.
Inside the Thread Group, you add Samplers-components that generate actual requests. An HTTP Request Sampler sends a GET or POST request to a specified URL. JMeter then measures the time taken to receive a response, checks for errors, and logs results.
JMeter uses a modular architecture. Key components include:
Common test types include:
| Type | Purpose | Use Case Example |
|---|---|---|
| Load Test | Measure performance under sustained load | Simulate 500 users logging in every minute for 1 hour |
| Stress Test | Determine breaking point | Gradually increase users until server crashes or response time exceeds 5 seconds |
| Endurance Test | Check stability over long durations | Run 1,000 users continuously for 24 hours |
| Throughput Test | Measure maximum transactions per second | Test how many API calls the system handles per second |
A non-obvious fact: JMeter doesn't require a GUI to run. You can execute test plans in headless mode using the command line, which reduces resource usage and enables integration into CI/CD pipelines. This capability is critical for automated regression testing.
Teams use JMeter to catch performance issues early. Without it, a website might work fine under normal conditions but fail during peak traffic-like Black Friday sales or viral product launches.
For example, a retail site launching a new feature might use JMeter to simulate 10,000 users adding items to their cart simultaneously. If the database locks or the response time spikes past 2 seconds, the team knows to improve queries or scale infrastructure before release.
According to the Apache JMeter project documentation, JMeter supports distributed testing-multiple machines can run test instances and send results to a central coordinator. This allows testing beyond a single machine's capacity, essential for large-scale systems.
JMeter is often mistaken for a tool that only tests websites. In reality, it supports nearly any network-based service. It can test databases via JDBC, message queues via JMS, and even mobile apps through custom HTTP headers.
Another misconception: JMeter is slow or hard to learn. While the GUI can feel overwhelming at first, its structure mirrors real-world user journeys. Once you understand the hierarchy-Test Plan > Thread Group > Sampler > Listener-it becomes intuitive.
I once spent a weekend setting up a JMeter test for a payment gateway. The initial setup failed due to incorrect timestamp formatting in a JSON payload. After adding a BeanShell PreProcessor to dynamically generate timestamps, the test passed. That experience taught me that JMeter isn't just about simulating load-it's about replicating real-world conditions precisely.
Also, JMeter is not a replacement for monitoring tools like Prometheus or New Relic. It complements them. JMeter tells you what happens during a test; monitoring tools show you what's happening in production.
To begin, download JMeter from the official Apache website. Install Java 8 or later. Launch the application and create a new Test Plan.
Add a Thread Group with 100 threads (users), a ramp-up period of 60 seconds (1 user per second), and a loop count of 10. Then add an HTTP Request Sampler pointing to your application's /api/login endpoint with a POST method and JSON body containing credentials.
Attach a View Results Tree listener to see individual request details. Run the test. JMeter will display response time, status code, and response body for each request.
If the test fails-say, 30% of requests return 500 errors-you can analyze the response to identify the root cause: perhaps the backend service is overloaded or missing a required header.
What is JMeter? It's a useful, free, and extensible tool for performance and load testing. It enables teams to verify system reliability, detect latency issues, and prevent outages before they impact real users. Its widespread adoption across industries confirms its role as a standard in software quality assurance.