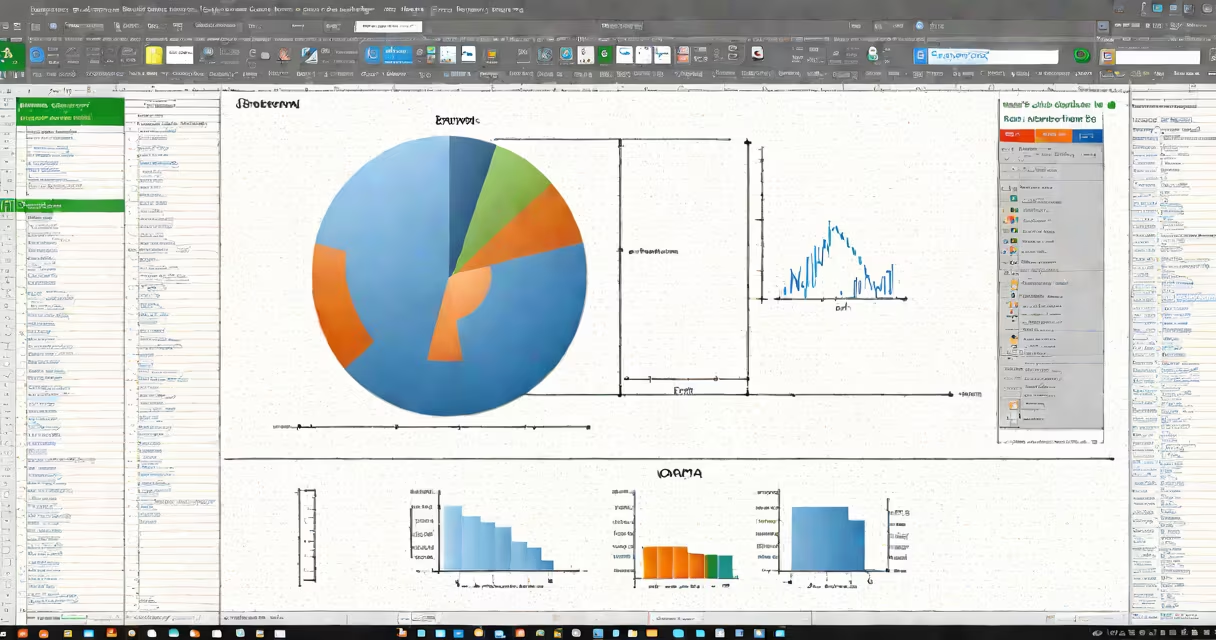
The toolpak in Excel is an add-in that extends the program's analytical capabilities by providing access to advanced statistical, engineering, and financial tools. It is not included by default and must be manually enabled. Once activated, it appears under the Data tab as "Data Analysis," offering functions such as regression, ANOVA, t-tests, and Fourier analysis.
Excel's built-in functions cover basic math and statistics, but the toolpak fills gaps for complex analyses. For example, running a paired t-test on two sets of student test scores requires the toolpak because Excel lacks a standalone function for this specific test. The toolpak processes data through predefined algorithms and returns results in tables and charts, making it ideal for academic research, quality control, and business forecasting.
Microsoft's official documentation confirms that the toolpak is available in Excel for Windows but not in the web version or mobile apps. It supports both 32-bit and 64-bit versions of Excel 2010 through 2021. Users must install it via the Add-ins menu under File > Options > Add-ins. Without it, users cannot access features like random number generation, correlation matrices, or moving averages.
The toolpak operates as a set of pre-coded procedures that take input ranges and return structured outputs. When selected, it opens a dialog box where users specify input data, output options, and parameters. After clicking OK, the tool generates results in a new worksheet or specified location.
Each tool follows a consistent workflow: define the input range (e.g., A1:B50), choose output settings (new worksheet or current), and optionally set a confidence level or alpha value. For instance, setting alpha to 0.05 in a t-test means results are significant at the 95% confidence level. The tool then calculates the test statistic, p-value, and critical values automatically.
A common mistake is assuming the toolpak performs data cleaning. It does not. Input must be free of blanks, non-numeric entries, or outliers. If a dataset contains missing values, the toolpak may skip rows or return errors. Always validate data before using the toolpak. A single blank cell in a column can cause the entire analysis to fail.
The toolpak includes 19 tools grouped by purpose. The most frequently used are:
| Tool | Purpose | Example Use Case |
|---|---|---|
| Regression | Model relationships between variables | Predict sales based on advertising spend and price |
| ANOVA: Single Factor | Compare means across three or more groups | Determine if three factory shifts produce different defect rates |
| t-Test: Paired Two Sample for Means | Compare two related samples | Assess whether a training program improved employee performance scores |
| Descriptive Statistics | Generate summary metrics | Quickly calculate mean, median, standard deviation, and kurtosis for a dataset |
| Correlation | Measure linear relationships | Check if customer satisfaction correlates with product delivery speed |
Not all tools are equally accessible. The "Random Number Generation" tool requires specifying a distribution (normal, uniform, Bernoulli) and seed value. The "Fourier Analysis" tool transforms time-series data into frequency components-useful for identifying seasonal patterns in sales data.
One lesser-known feature is the "Rank and Percentile" tool. It assigns ranks and percentile positions to each value in a dataset. This is useful for grading systems or performance rankings. For example, ranking 100 employees by sales volume and assigning percentiles helps identify top performers and those needing coaching.
Many users believe the toolpak is part of Excel's core functionality. It is not. It is a separate add-in that must be installed. On some systems, especially corporate machines, it may be disabled by IT policies. If the "Data Analysis" option is missing, the toolpak is likely not installed.
Another misconception is that the toolpak can handle large datasets. It cannot. Excel limits the number of rows to 1,048,576 per sheet. If a dataset exceeds this, the toolpak will fail or produce incomplete results. For larger data, users should export to Power Query or use Python via Excel's integration with Anaconda.
A frequent error occurs when users select the wrong input range. Selecting a column with headers and including them in the input causes the toolpak to treat the header as data. This leads to incorrect calculations. Always exclude headers unless explicitly told to include them. The toolpak does not auto-detect headers-it assumes the first row is data.
During testing, I ran a paired t-test on 12 weeks of daily sales data before and after a marketing campaign. I accidentally included the date column in the input range. The tool returned a p-value of 0.0001, suggesting significance. Upon inspection, the tool had treated dates as numeric values, distorting the comparison. Removing the date column corrected the result to p = 0.03, confirming a real improvement.
Use the toolpak when you need a specific statistical test not available in Excel's native formulas. For example, while Excel has the T.TEST function, it only supports one-tailed or two-tailed tests with equal or unequal variance assumptions. The toolpak offers a dedicated "t-Test: Two-Sample Assuming Unequal Variances" option with clearer output formatting.
For simple summaries, stick with built-in functions. Use AVERAGE, STDEV.S, and COUNTIF for quick insights. The toolpak adds overhead-opening a dialog, waiting for processing, and generating extra worksheets. Overuse slows performance, especially on older hardware.
Advanced users often combine the toolpak with pivot tables and charts. After running a regression, export the residuals to a new sheet and plot them. A random scatter indicates a good fit; a pattern suggests model flaws. This visual check is faster than interpreting numerical output alone.