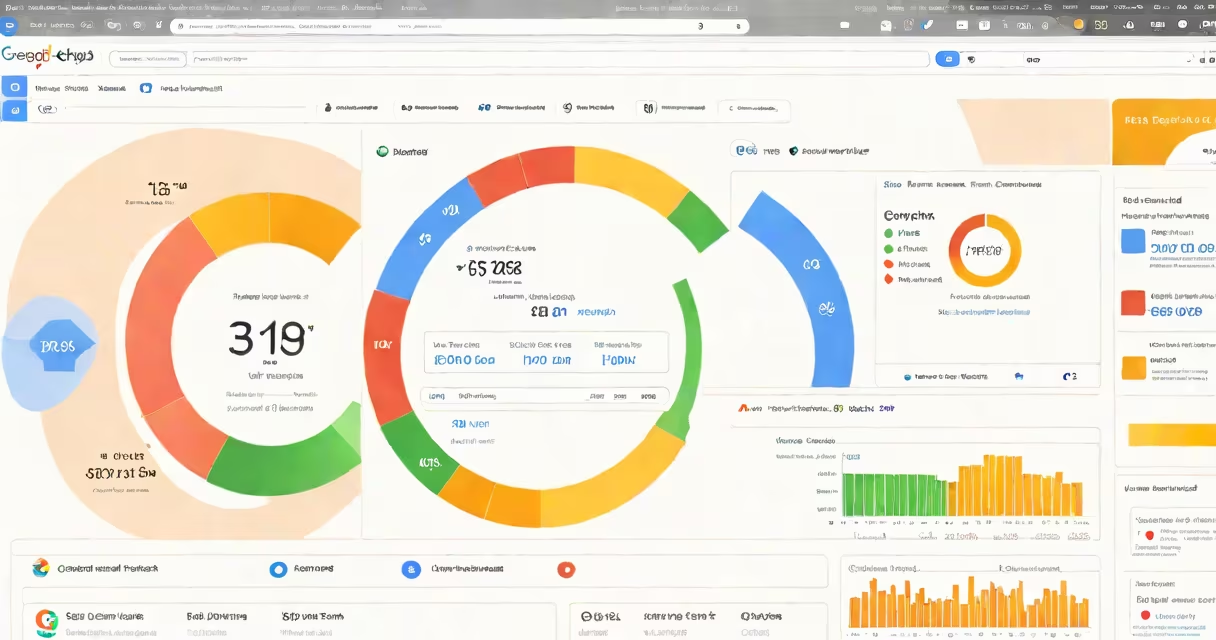
Google Pagespeed Insights tool is a free web performance analyzer that evaluates how quickly a webpage loads on mobile and desktop devices, then provides specific recommendations to improve speed, usability, and core web vitals.
The tool pulls data from real-world user experiences via the Chrome User Experience Report (CrUX) and lab data from Lighthouse, a browser automation structure. It returns a score from 0 to 100 for both mobile and desktop, with 90+ considered good, 50-89 acceptable, and below 50 needing improvement.
For example, a travel blog with a homepage loading in 6.2 seconds on mobile received a score of 47. The report flagged large images (over 2MB), unoptimized JavaScript, and render-blocking resources as key issues. After compressing images, deferring non-critical scripts, and enabling browser caching, the load time dropped to 2.1 seconds and the score rose to 89.
When you enter a URL, Google Pagespeed Insights runs automated tests using real browsers in controlled environments. It measures metrics like First Contentful Paint (FCP), Largest Contentful Paint (LCP), and Time to Interactive (TTI).
It uses Lighthouse to simulate page rendering under typical network conditions. Lighthouse generates a detailed audit report that includes performance, accessibility, best practices, and SEO categories. The tool combines this with real-world data from millions of actual user sessions collected through Chrome.
Results appear in two panels: a performance score and a list of actionable fixes. Each recommendation includes a severity level (minor, moderate, major) and a technical explanation. For instance, "Reduce unused JavaScript" appears under "Opportunities" and explains that 1.2MB of unused code was detected in a site's main bundle.
Google Pagespeed Insights relies on two primary data sources: lab data and field data.
Lab data comes from Lighthouse, which runs in a simulated environment with consistent network speeds and device configurations. This allows for repeatable testing across different sites and versions.
Field data comes from CrUX, which aggregates real user performance data from Chrome users worldwide. It reflects actual loading behavior on various networks and devices, including slower connections and older hardware.
| Data Type | Source | Use Case |
|---|---|---|
| Lab Data | Lighthouse (simulated) | Testing changes during development |
| Field Data | Chrome User Experience Report (CrUX) | Understanding real-world user experience |
Both datasets are essential. Lab data helps developers test fixes locally. Field data shows whether those fixes actually improve user experience at scale.
Web developers, SEO specialists, and site owners use Google Pagespeed Insights to identify bottlenecks affecting search rankings and conversion rates.
Page speed is a confirmed ranking factor in Google's algorithm. A 2021 study by web.dev showed that pages loading in under 2 seconds have a 35% higher chance of converting visitors into customers compared to those taking longer than 5 seconds.
For e-commerce sites, even a 1-second delay in load time can reduce conversions by up to 7%. A fashion retailer reduced bounce rate by 22% after fixing issues flagged by the tool, including lazy-loading product images and minifying CSS files.
Many assume that a high score guarantees good performance. That's incorrect. A score above 90 doesn't mean the site is fast for all users-it only means it met lab test criteria under ideal conditions.
Another common error is treating the tool's suggestions as mandatory. Not all recommendations apply equally. For example, "Preload key requests" may not benefit sites with low traffic or static content. Prioritize fixes based on impact, not just presence.
A non-obvious fact: the tool sometimes flags assets that are already optimized. For instance, a site using WebP images still showed "Convert to WebP" as a suggestion. This occurred because the original file was served as JPEG due to a misconfigured CDN rule. The fix wasn't changing the format-it was correcting the delivery logic.
I once ran the tool on a client's site that had a 94/100 score. Despite the high rating, users reported slow loading on Android 10 devices. Re-running the test with a custom device profile revealed that the site failed to serve responsive images for older Android browsers. The solution involved adding srcset attributes and updating the CDN configuration-fixes not flagged in the default report.
While Google Pagespeed Insights is the most widely used tool, others exist with different focus areas.
| Tool | Focus | Best For |
|---|---|---|
| Google Pagespeed Insights | Performance, Core Web Vitals, SEO | Full-site evaluation, SEO optimization |
| WebPageTest.org | Real-world network simulation, waterfall analysis | Detailed diagnostics, multi-location testing |
| Lighthouse (in DevTools) | Code-level auditing, developer debugging | Local development, rapid iteration |
Pagespeed Insights differs from WebPageTest.org in that it prioritizes user-centric metrics over raw timing data. While WebPageTest shows every request in a waterfall chart, Pagespeed Insights summarizes them into actionable insights.
Unlike Lighthouse, which runs in a local browser context, Pagespeed Insights includes field data from real users. This makes it better suited for assessing real-world impact than for debugging isolated code issues.
Google Pagespeed Insights tool is not a standalone solution. It's a diagnostic instrument that identifies gaps between expected and actual performance. Use it alongside monitoring tools like Google Analytics and Sentry to track improvements over time.
Always validate changes in production. A fix that improves the score may introduce layout shifts or increase memory usage. Test on real devices and monitor user behavior before rolling out updates.
For ongoing maintenance, integrate the tool into your CI/CD pipeline. Automate checks on pull requests to catch regressions early. The goal isn't perfection-it's consistent improvement.