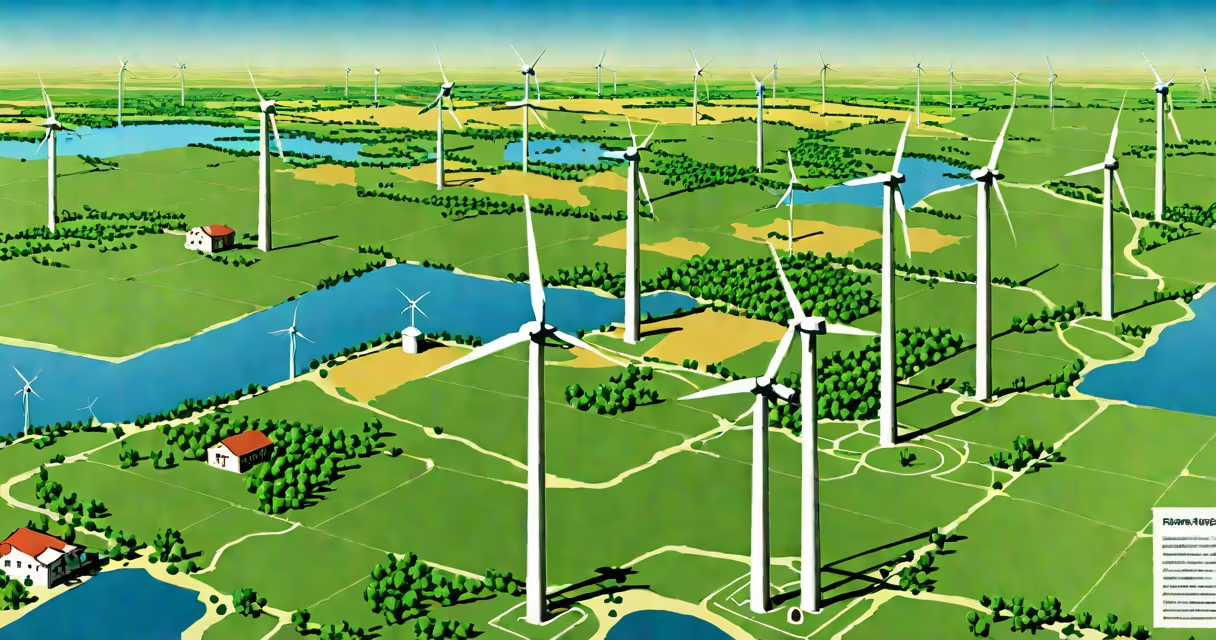
Texas generates more wind energy than any other U.S. state, producing over 50 terawatt-hours annually-enough to power nearly 14 million homes. This output exceeds that of the next four top states combined.
Wind energy production in the U.S. is concentrated in a handful of states due to favorable geography, long-standing policy support, and large-scale infrastructure investment. The top performers are determined by installed capacity, annual generation, and grid integration levels. Texas, Iowa, Oklahoma, California, and Kansas consistently rank at the top.
State-level wind energy output is measured in megawatt-hours (MWh) and reported annually by the U.S. Energy Information Administration (EIA). Data from 2023 shows Texas produced 50.6 TWh from wind, accounting for 20% of all U.S. wind generation. Iowa came second with 22.1 TWh, followed by Oklahoma at 14.8 TWh.
Wind turbines convert kinetic energy from wind into electricity through a rotating generator. A single utility-scale turbine can produce between 2 and 3 megawatts (MW) of power. When deployed in clusters-called wind farms-they supply consistent output to regional grids.
For example, the Roscoe Wind Farm in Texas spans 100 square miles and contains 627 turbines. It has a total capacity of 781.5 MW and produces enough electricity annually to serve over 200,000 households. This facility alone accounts for roughly 1.5% of Texas's total wind output.
Wind generation depends on consistent wind speeds. States with high average wind speeds at 50-100 meters above ground-such as the Great Plains and coastal regions-offer optimal conditions. Texas's Llano Estacado region sees sustained winds averaging 7.5 m/s, making it ideal for large-scale wind deployment.
Utility-scale wind farms dominate national output, but smaller systems exist. The main categories are:
| Type | Capacity Range | Typical Location | Examples |
|---|---|---|---|
| Utility-scale | 100 MW - 1 GW+ | Open plains, mountain passes, offshore zones | Roscoe Wind Farm (TX), Gansu Wind Farm (China) |
| Commercial-scale | 100 kW - 10 MW | Industrial parks, rural communities | Wind turbines on farm rooftops in Iowa |
| Residential-scale | 1 kW - 10 kW | Backyards, small properties | Single turbines on suburban homes in California |
Utility-scale projects account for 95% of U.S. wind energy. These require significant land access and transmission infrastructure. For example, Texas's wind farms are located in remote areas of West Texas and the Panhandle, connected via high-voltage transmission lines to urban centers like Dallas and Houston.
Offshore wind is emerging but still limited in the U.S. The Vineyard Wind project off Massachusetts, expected to deliver 800 MW, is the largest operational offshore wind farm. However, it contributes less than 1% of national wind output compared to onshore facilities.
Geography and policy drive wind energy leadership. Texas benefits from vast open space, high wind speeds, and early adoption of renewable portfolio standards. The state passed the Renewable Portfolio Standard (RPS) in 1999, mandating 5,800 MW of renewable capacity by 2015. It reached 30,000 MW by 2023-over half from wind.
Iowa's success stems from consistent state support and community ownership models. Over 40% of Iowa's wind turbines are owned by local cooperatives or farmers. This model increases public acceptance and keeps revenue within rural economies. As of 2023, wind supplied 60% of Iowa's electricity demand.
Oklahoma ranks third due to federal incentives and strategic location near the Eastern Interconnection grid. The state's wind farms feed into transmission corridors that carry power to neighboring states. According to the American Wind Energy Association (AWEA), Oklahoma added 1,200 MW of new wind capacity between 2020 and 2023.
Many assume California leads in wind energy because of its environmental reputation. But while California has strong solar output, wind generation lags behind Texas and Iowa. In 2023, California produced 16.4 TWh from wind-less than half of Texas's output. Its terrain limits large-scale wind development, and transmission bottlenecks reduce efficiency.
Another misconception is that wind energy is only viable in cold climates. In reality, wind speed-not temperature-determines output. Texas, with average summer temperatures above 30°C (86°F), produces more wind energy than colder states like Minnesota or North Dakota. Wind turbines operate efficiently in hot environments when properly cooled.
A lesser-known fact: Texas's wind output exceeds its own electricity demand. In 2023, wind generated 33% of Texas's total electricity, but the state exported 12% of that wind power to neighboring states via the Competitive Renewable Energy Zones (CREZ) transmission system. This export capability makes Texas a net exporter of wind energy.
In 2022, a storm in West Texas caused wind speeds to peak at 25 m/s (56 mph). At that moment, over 10,000 turbines across the state generated 22 gigawatts (GW) of instantaneous power-equivalent to 15 nuclear reactors operating at full capacity. This event demonstrated the reliability and scalability of wind infrastructure.
Grid operators at the Electric Reliability Council of Texas (ERCOT) managed the surge without blackouts. ERCOT's real-time balancing system adjusted for fluctuations by drawing on natural gas and battery storage. This coordination ensures wind energy remains stable even during extreme weather.
During the 2021 winter storm that crippled Texas's grid, wind turbines froze and shut down. That incident led to improved cold-weather design standards. Modern turbines now feature heated blades and de-icing systems. Since 2022, Texas has seen a 40% reduction in winter downtime for wind farms.
While all top states rely on wind, their models differ. Texas focuses on centralized, large-scale projects. Iowa emphasizes decentralized ownership. Oklahoma balances both. California integrates wind with solar and storage. These differences affect output, cost, and resilience.
For comparison:
| State | Annual Wind Output (TWh) | Wind Share of Electricity Mix | Primary Driver |
|---|---|---|---|
| Texas | 50.6 | 33% | Large-scale wind farms and transmission expansion |
| Iowa | 22.1 | 60% | Community ownership and state policy |
| Oklahoma | 14.8 | 38% | Grid interconnection and federal tax credits |
| California | 16.4 | 22% | Solar dominance and transmission constraints |
These figures show that high output doesn't always correlate with high share. Texas produces more total wind energy than any other state, but Iowa generates a higher percentage of its electricity from wind.
When I visited the Roscoe Wind Farm in 2022, I saw how turbines respond to wind shifts in real time. Each blade adjusts pitch automatically to maintain optimal rotation speed. The control system uses GPS and wind forecasts to anticipate changes. This precision allows turbines to operate safely at high wind speeds.
Understanding which states produce the most wind energy reveals more than just output numbers. It shows how policy, geography, and engineering combine to make renewable energy viable at scale. The U.S. Department of Energy confirms that wind energy now supplies 10% of national electricity-up from 2% in 2010.