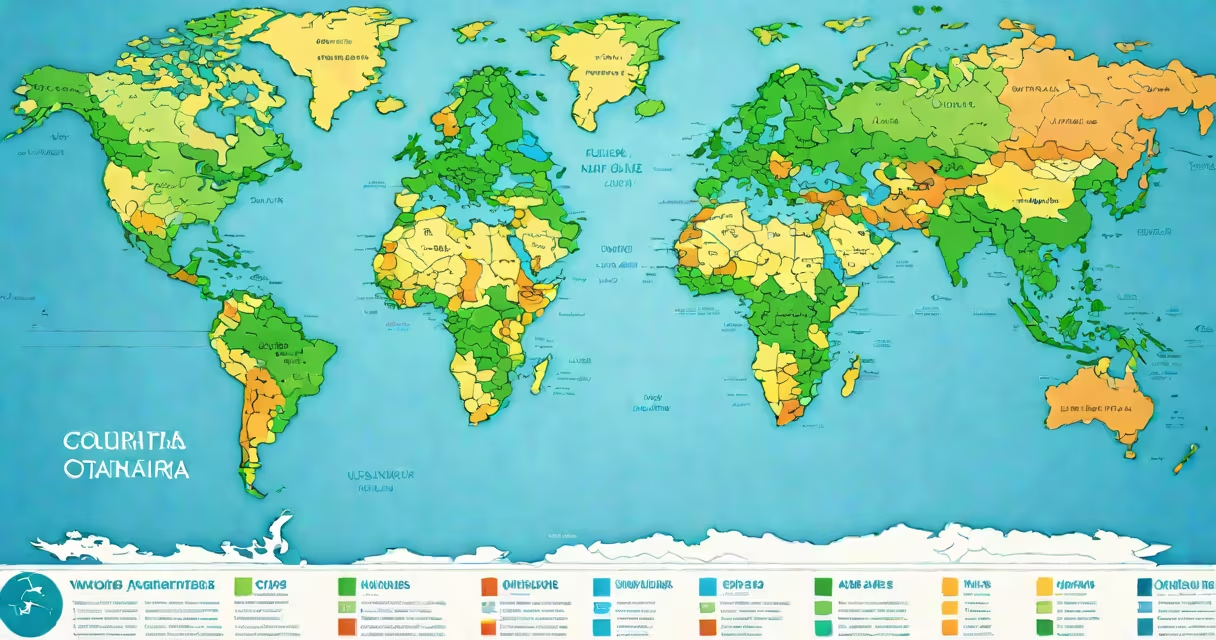
Maps of world are visual representations of Earth's surface that show geographical features, political boundaries, physical landscapes, and human-made structures. They translate three-dimensional reality onto flat surfaces using standardized projections, scales, and symbols.
These maps serve as tools for navigation, education, scientific research, and global communication. The most common types include political maps (showing countries and borders), physical maps (depicting mountains, rivers, and elevation), and thematic maps (conveying data like population density or climate patterns).
Modern maps of world rely on satellite imagery, GPS coordinates, and geospatial databases. The United Nations and national mapping agencies maintain standards for accuracy and consistency. For example, the U.S. Geological Survey's National Map provides high-resolution data used in official cartographic products.
Mapmakers convert spherical Earth data into flat formats using mathematical projections. Each projection distorts some aspect-area, shape, distance, or direction-to preserve others. The Mercator projection, widely used in classrooms, preserves angles and shapes near the equator but exaggerates size near the poles, making Greenland appear larger than Africa despite being much smaller.
Scale determines how much detail fits on a given space. A 1:10,000,000 scale map shows 1 cm representing 100 km. This allows users to estimate distances between cities. Digital maps update in real time using live data feeds from satellites and ground sensors.
Cartographers assign colors and symbols to represent features. Blue lines indicate rivers; green areas show forests; red dots mark capital cities. These conventions are standardized internationally through organizations like the International Cartographic Association.
Different purposes require different map styles. Here's a breakdown of core categories:
| Type | Shows | Use Case | Example |
|---|---|---|---|
| Political | Nations, borders, capitals | International relations, travel planning | UN map of member states |
| Physical | Mountains, rivers, elevation | Geology, environmental science | USGS topographic map series |
| Thematic | Climate, population, trade routes | Data analysis, policy development | World Bank's poverty rate map (2023) |
| Climate | Temperature zones, precipitation | Weather forecasting, agriculture | NOAA's global temperature anomaly map |
Some maps combine multiple layers. A climate map might overlay political boundaries and ocean currents to analyze regional weather patterns. These composite maps are common in climate modeling and disaster preparedness planning.
Many people assume all maps of world are equally accurate. That's false. The choice of projection affects perception. The Gall-Peters projection, for instance, preserves area but distorts shape, making equatorial regions look stretched. It was adopted by some educational institutions to correct historical biases favoring Northern Hemisphere nations.
Another misconception is that maps never change. In reality, borders shift due to conflict, treaties, or independence movements. The map of Europe changed after the fall of the Berlin Wall and the dissolution of Yugoslavia. Updated versions reflect current geopolitical realities.
A lesser-known fact: no single map projection can perfectly represent Earth's curvature without distortion. Even the most advanced digital maps use approximations. The Google Maps system uses the Web Mercator projection-a variant of Mercator optimized for screen display-but it distorts landmasses near the poles.
In 2019, researchers at the University of California, Santa Barbara used detailed maps of world to track deforestation in the Amazon rainforest. By comparing satellite images over time, they identified a 12% increase in cleared land between 2015 and 2018. This data informed conservation efforts and policy decisions in Brazil and neighboring countries.
During the 2020 pandemic, health agencies relied on interactive maps of world to visualize infection rates. The Johns Hopkins University Coronavirus Resource Center published daily updates showing case counts by country. These maps helped governments allocate medical supplies and implement travel restrictions.
I once used a custom map of world to plan a cross-country road trip across North America. I layered route suggestions from Google Maps with elevation data from the USGS. The resulting view showed steep mountain passes and long stretches of desert. It helped me avoid dangerous terrain and choose fuel-efficient driving routes.
Maps of world remain essential tools for understanding our planet. They are not static images but changing records shaped by science, politics, and human experience.