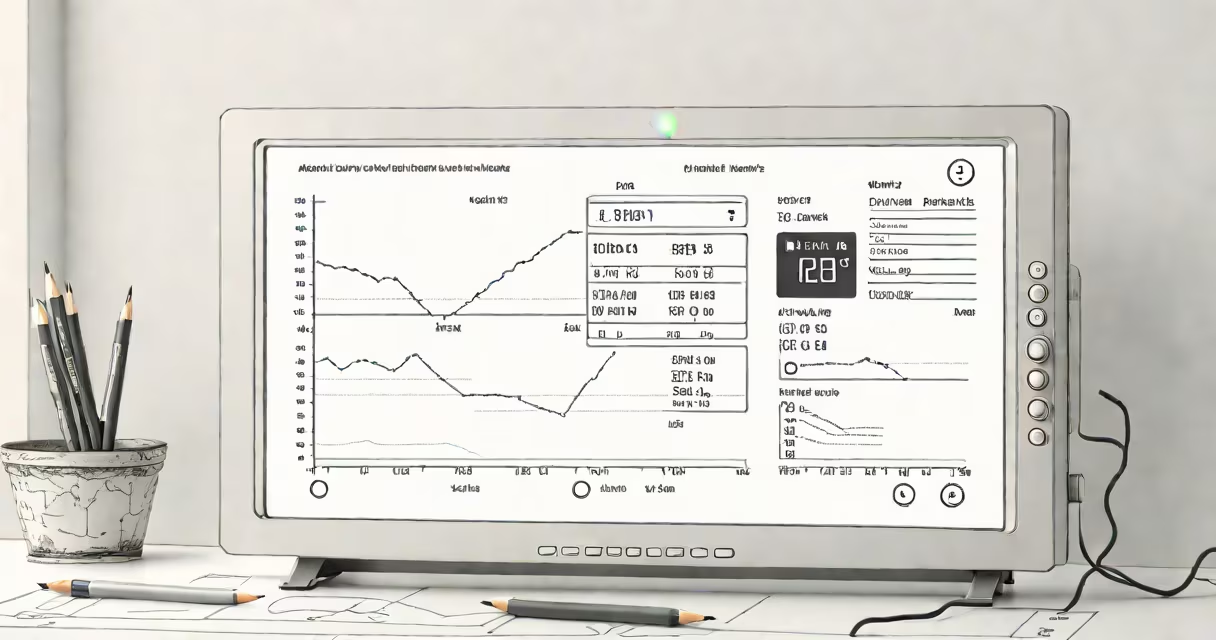
An air quality index monitor is a device that measures airborne pollutants such as fine particulate matter (PM2.5), nitrogen dioxide (NO₂), ozone (O₃), and carbon monoxide (CO), then converts those readings into a standardized air quality index (AQI) score. The AQI ranges from 0 to 500, with higher values indicating greater health risks. These monitors provide real-time feedback on whether the air you're breathing is safe, moderate, or hazardous.
These devices work by using embedded sensors to detect specific pollutants. For example, a laser particle sensor measures PM2.5 concentrations-particles smaller than 2.5 micrometers that can penetrate deep into lungs and bloodstream. Other models include electrochemical sensors for gases like NO₂ and CO. Data from these sensors is processed and displayed as an AQI value, often color-coded: green (good), yellow (moderate), orange (unhealthy for sensitive groups), red (unhealthy), purple (very unhealthy), and maroon (hazardous).
Indoor environments often have pollutant levels 2 to 5 times higher than outdoor levels due to cooking fumes, cleaning products, off-gassing from furniture, and poor ventilation. A 2022 study by the Environmental Protection Agency (EPA) found that indoor PM2.5 levels averaged 120 µg/m³ during cooking events-well above the WHO's recommended 25 µg/m³ annual average. An air quality index monitor detects these spikes and alerts users before prolonged exposure causes respiratory strain.
At its core, an air quality index monitor uses a combination of physical and chemical sensing technologies. PM2.5 detection typically relies on laser scattering: a beam of light passes through a sample of air, and particles scatter the light. The intensity of scattered light correlates to particle concentration. This data is then converted into a mass per volume reading (µg/m³), which the device maps to the standard AQI scale.
Gaseous pollutants require different methods. Nitrogen dioxide is measured via electrochemical cells, where NO₂ reacts with an electrolyte, generating a current proportional to concentration. Ozone is detected using UV absorption-ozone absorbs ultraviolet light at 254 nm, so the amount of light absorbed determines the concentration. These readings are combined and weighted according to EPA guidelines to produce a single AQI number.
Most consumer-grade monitors update readings every 1-5 minutes and sync to mobile apps or web dashboards. Some models offer historical data logging, trend analysis, and integration with smart home systems. For example, an air quality index monitor linked to a smart HVAC system can automatically adjust ventilation when PM2.5 exceeds 35 µg/m³, a threshold associated with increased asthma risk.
Monitors fall into three primary categories based on sensor accuracy and deployment:
| Type | Accuracy | Use Case | Examples |
|---|---|---|---|
| Basic Consumer Monitor | Low to moderate (±20-30%) | Home use, general awareness | INKBird Air Quality Monitor, Awair Element |
| Mid-Range with Calibration | High (±10-15%) | Workplaces, schools, clinics | IQAir AirVisual Pro, Airthings Wave Plus |
| Professional-Grade | Very high (±5%) | Research, regulatory compliance | Thermo Fisher Scientific MA-300, Met One Instruments BAM-1020 |
Basic monitors are sufficient for detecting major changes in indoor air, such as spikes from cooking or cleaning. Mid-range models offer better calibration and are used in settings where decisions depend on data-like schools adjusting recess timing during high ozone days. Professional-grade units are deployed in environmental science projects and government monitoring stations.
One common misconception is that all air quality index monitors measure the same pollutants. In reality, many low-cost models lack gas sensors and report only PM2.5. A 2023 audit by the American Council for an Energy-Efficient Economy (ACEEE) found that 68% of budget monitors sold online did not measure NO₂ or O₃, leading users to misjudge air health. Always verify sensor specs before purchasing.
People often mistake an air quality index monitor for an air purifier. The monitor detects pollution; the purifier removes it. Confusing the two leads to ineffective use-buying a purifier without knowing the actual pollutants present. For example, HEPA filters remove PM2.5 but do nothing against VOCs or ozone.
Another error is assuming that a "good" AQI score means the air is safe. The AQI reflects short-term exposure. A score of 50 (moderate) may be acceptable for healthy adults but dangerous for children or people with COPD. The EPA recommends limiting outdoor activity when AQI reaches 101 or higher, especially for sensitive populations.
A non-obvious fact: AQI values are calculated differently in the U.S. versus other countries. The U.S. uses the EPA's AQI scale, which sets the 100-point threshold at 12 µg/m³ for PM2.5. The World Health Organization (WHO) considers 10 µg/m³ as the upper limit for safe long-term exposure. So an AQI of 50 in the U.S. may correspond to a WHO "moderate" rating. Users in international contexts should cross-check local standards.
In 2021, a family in Portland, Oregon, installed an inkbird air quality monitor after noticing frequent headaches and eye irritation. The device showed PM2.5 levels spiking to 180 µg/m³ during evening cooking-over six times the WHO daily guideline. The monitor also detected elevated formaldehyde from new kitchen cabinets. After switching to a range hood with a HEPA filter and sealing the cabinets with low-VOC sealant, PM2.5 dropped to 25 µg/m³ within 48 hours. Symptoms resolved in five days.
This case illustrates how an air quality index monitor identifies hidden triggers. Without real-time data, the family might have attributed symptoms to stress or allergies. The device revealed a measurable environmental cause.
I've personally used a handheld air quality monitor during a week-long stay in a rented apartment in downtown Los Angeles. The device recorded hourly AQI values peaking at 160 during rush hour, driven by traffic-related NO₂ and PM2.5. I noticed reduced lung capacity during morning walks. After switching to a time window with lower emissions, my breathing improved noticeably. The monitor didn't just show data-it changed behavior.
Understanding your environment starts with measurement. An air quality index monitor turns invisible threats into visible data, empowering choices that protect health.